PSY 520 Topic 1 Exercise
Chapter One
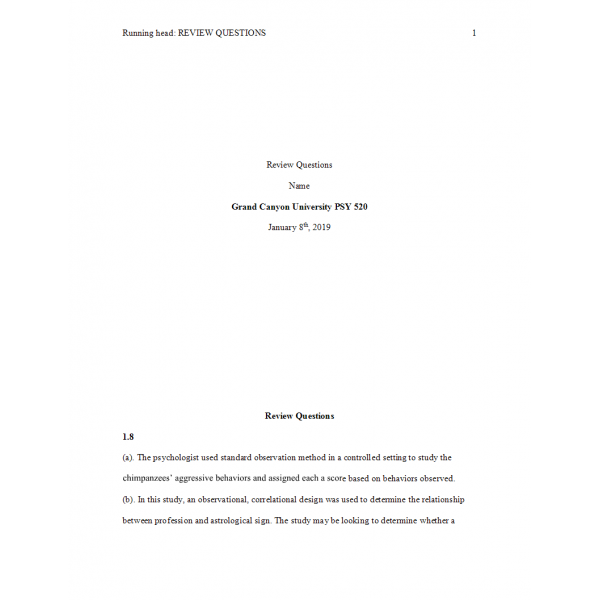
1.8 Indicate whether each of the following studies is an experiment or an observational study. If it is an experiment, identify the independent variable and note any possible confounding variables.
Chapter Two
2.14
(a) Construct a frequency distribution for the number of difference residences occupied by graduating seniors during their college career, namely 1, 4, 2, 3, 3, 1, 6, 7, 4, 3, 3, 9, 2, 4, 2, 2, 3, 2, 3, 4, 4, 2, 3, 3, 5
(b) What is the shape of this distribution?
2.17 Are there any conspicuous differences between the two distributions in the following table (one reflecting the ages of all residents of a small town and the other reflecting the ages of all U.S. residents)?
(a) To help make the desired comparison, convert the frequencies (f) for the small town to percentages.
(b) Describe any seemingly conspicuous differences between the two distributions.
2.18 The following table shows distributions of bachelor’s degrees earned in 2005–2006 for selected fields of study by all male graduates and by all female graduates.
Chapter Three
3.13 Garrison Keillor, host of the radio program A Prairie Home Companion , concludes each story about his mythical hometown with “That’s the news from Lake Wobegon, where all the women are strong, all the men are good-looking, and all the children are above average.” In what type of distribution, if any, would
3.14 The mean serves as the balance point for any distribution because the sum of all scores, expressed as positive and negative distances from the mean, always equals zero.
3.19 Indicate whether the following terms or symbols are associated with the population mean, the sample mean, or both means.
Chapter Four
4. 9 For each of the following pairs of distributions, first decide whether their standard deviations are about the same or different. If their standard deviations are different, indicate which distribution should have the larger standard deviation. Hint: The distribution with the more dissimilar set of scores or individuals should produce the larger standard deviation regardless of whether, on average, scores or individuals in one distribution differ from those in the other distribution.
(a) SAT scores for all graduating high school seniors (a 1 ) or all college freshmen (a 2 )
(b) Ages of patients in a community hospital (b 1 ) or a children’s hospital (b 2 )
(c) Motor skill reaction times of professional baseball players (c 1 ) or college students (c 2 )
(d) GPAs of students at some university as revealed by a random sample (d 1 ) or a census of the entire student body (d 2 )
(e) Anxiety scores (on a scale from 0 to 50) of a random sample of college students taken from the senior class (e 1 ) or those who plan to attend an anxiety-reduction clinic (e 2 )
4.14
(a) Using the computation formula for the sample sum of squares, verify that the sample standard deviation, s , equals 23.33 lbs for the distribution of 53 weights in Table 1.1.
(b) Verify that a majority of all weights fall within one standard deviation of the mean (169.51) and that a small minority of all weights deviate more than two standard deviations from the mean.
4. 17 Why can’t the value of the standard deviation ever be negative?
4.19 Referring to Review Question 2.18 on page 55, would you describe the distribution of majors for all male graduates as having maximum, intermediate, or minimum variability?
| Institution & Term/Date | |
| Term/Date | Grand Canyon |
PSY 520 Topic 1 Exercise 1, Chapter 1 to 4
- Product Code: 2019
- Availability: In Stock
-
$12.00

