BUSI 411 Exam 3, Operations Management
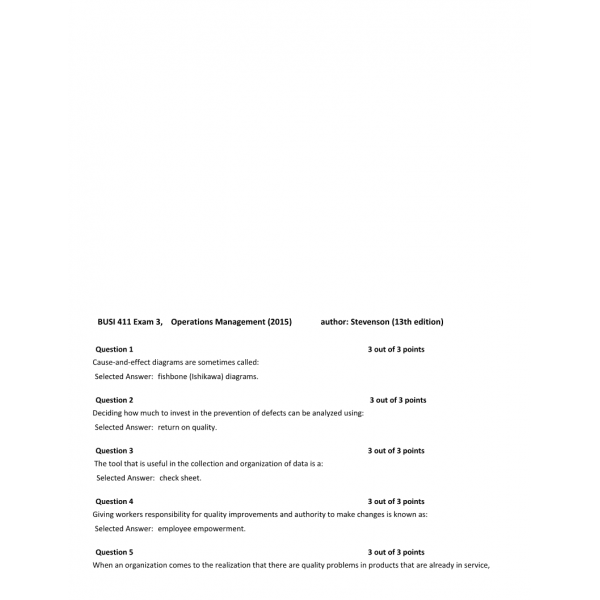
1. Cause-and-effect diagrams are sometimes called:
2. Deciding how much to invest in the prevention of defects can be analyzed using:
3. The tool that is useful in the collection and organization of data is a:
4. Giving workers responsibility for quality improvements and authority to make changes is known as:
5. When an organization comes to the realization that there are quality problems in products that are already in service, ethical approaches include:
6. A quality analyst wants to construct a control chart for determining whether four machines, all producing the same product, are in control with regard to a particular quality attribute. Accordingly, she inspected 1,000 units of output from each machine in random samples, with the following results:
7. A quality analyst wants to construct a sample mean chart for controlling a packaging process. He knows from past experience that whenever this process is in control, package weight is normally distributed with a mean of 20 ounces and a standard deviation of two ounces. Each day last week, he randomly selected four packages and weighed each:
8. The following data occurs chronologically from left to right:
9. The greater the volume of the process being targeted for inspection, the more attractive __________ inspection is.
10. A quality analyst wants to construct a control chart for determining whether four machines, all producing the same product, are in control with regard to a particular quality attribute. Accordingly, she inspected 1,000 units of output from each machine in random samples, with the following results:
11. Information for firm ABC:
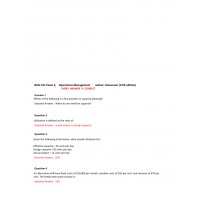
12. One option for altering the availability of manufacturing capacity is:
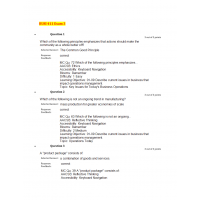
13. Which of the following are typically in play in a circumstance in which yield management is worthwhile?
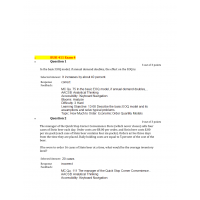
14. Aggregate planners seek to match supply and demand:
15. A firm has 43 units of a certain product on hand. Forecasts for the first two planning periods are 20 units each. A production quantity of 80 units is planned to be available in period 3. Customer orders are 22 for period 1 and 17 for period 2. What is the projected on-hand inventory at the end of period 2?
16. The _________ of ERP makes it valuable as a strategic planning tool.
17. ERP implementation probably will not require:
18. _______ is choosing how many to order or make each time an order is planned.
19. In MRP, the gross requirements of a given component part are calculated directly from:
20. An MRP system that is updated periodically to account for all changes which have occurred within a given time interval is called a(n) ________ system.
21. ISO standards aid in transferring technology to developing countries.
22. Range charts and p-charts are both used for variable data.
23. Ultimately the overriding factor in choosing a strategy in aggregate planning is overall cost.
24. MRP, considering inventory position, bills of material, open purchase orders, and lead times guarantees a feasible production plan if the inputs to MRP are accurate.
25. Load reports show capacity requirements for departments or work centers which may be more or less than the capacity available in that work center.
| Institution & Term/Date | |
| Term/Date | Liberty University |
BUSI 411 Exam 3 - Operations Management
- Product Code: 2021
- Availability: In Stock
-
$19.99
Related Products
BUSI 411 Exam 3 (Set 2)
$15.00
BUSI 411 Exam 4 - Set 2
$19.99
BUSI 411 Exam 4 - Set 3
$19.99
BUSI 411 Exam 4
$19.99
